Tools
Curves
Changing tones with a curve: adding, moving and removing points.
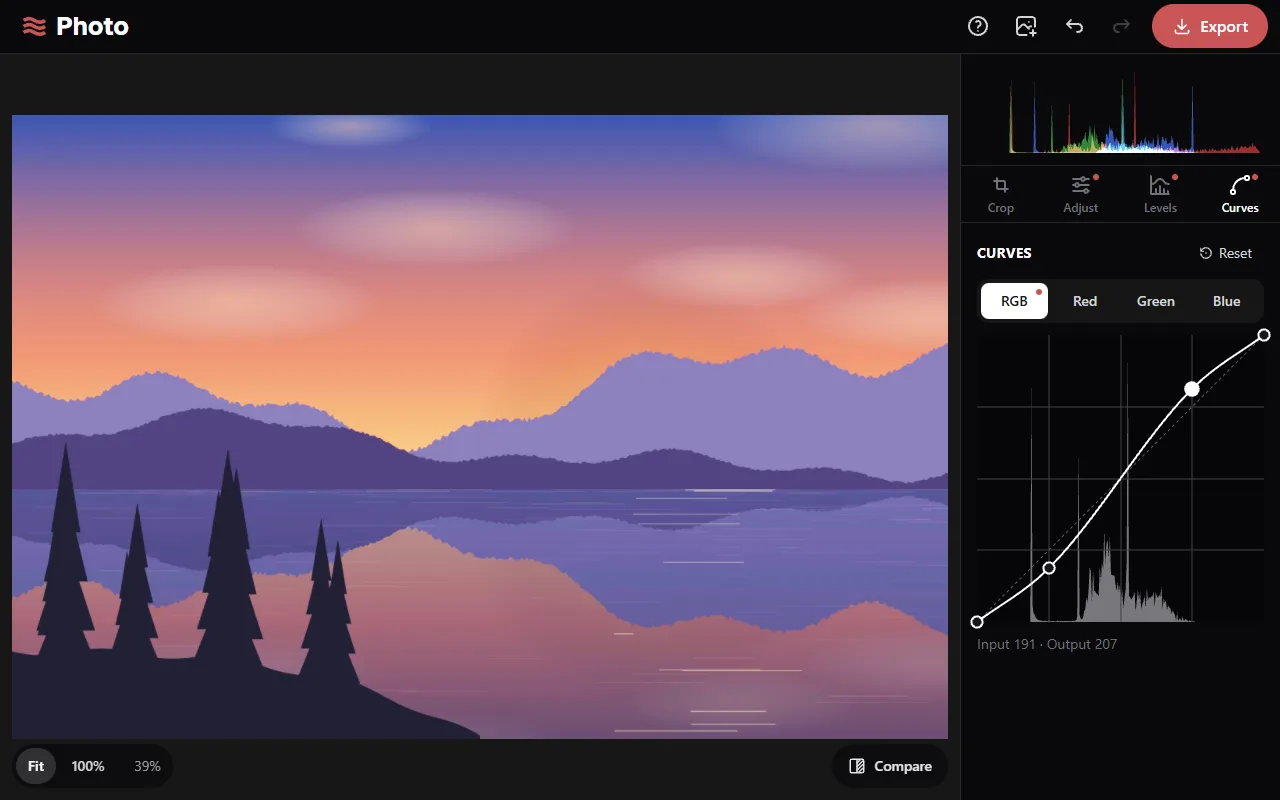
The graph
The horizontal axis is the input brightness, from black on the left to white on the right. The vertical axis is the output brightness. The diagonal line means no change. Raising part of the curve brightens those tones; lowering it darkens them.
The histogram behind the graph shows the photo with Levels applied.
Points
- Click the curve to add a point, then drag it.
- Double-click a point, or drag it off the graph, to remove it. The two end points can't be removed.
- With a point selected, the arrow keys move it (Shift for steps of 10) and Delete removes it.
- The values under the graph are the selected point's input and output.
The curve passes through every point and doesn't overshoot between them.
Example shapes
Channels
Red, Green and Blue each have their own curve. For example, raising the Blue curve near the left and lowering it near the right adds blue to the shadows and yellow to the highlights.